The system TCU has more than a hundred reports in different ways. Despite this, meet the diverse needs of users can only Report Designer TCU. It allows you to create reports to fit their specific requirements.
Company ANDRIY.CO tried to implement an interface designer in the likeness of the Report Designer Microsoft Access. This solution has several advantages:
- Report Design MS Access sign a large number of users because it is part of the package MS Office.
- Presence of a large amount of literature on the constructor MS Access makes it possible to obtain information on the work of designer TCU.
To extract relevant information from the database in Report Designer TCU used query language SQL (Structured Query Language - Structured Query Language). The program has a special tool for creating SQL-queries.
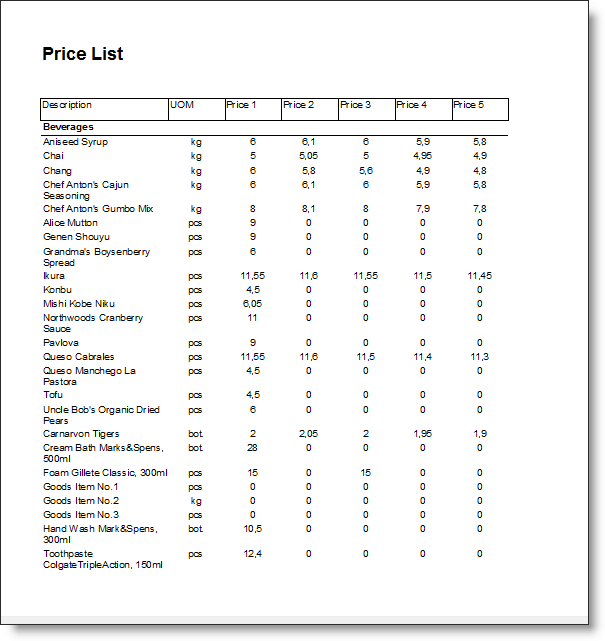
consider how to create a simple report Prices. Our goal - to show how easily and quickly create custom reports TCU.
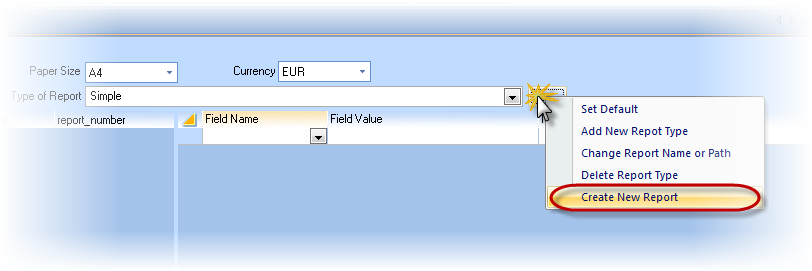
Open Report Wizard and create a new account.
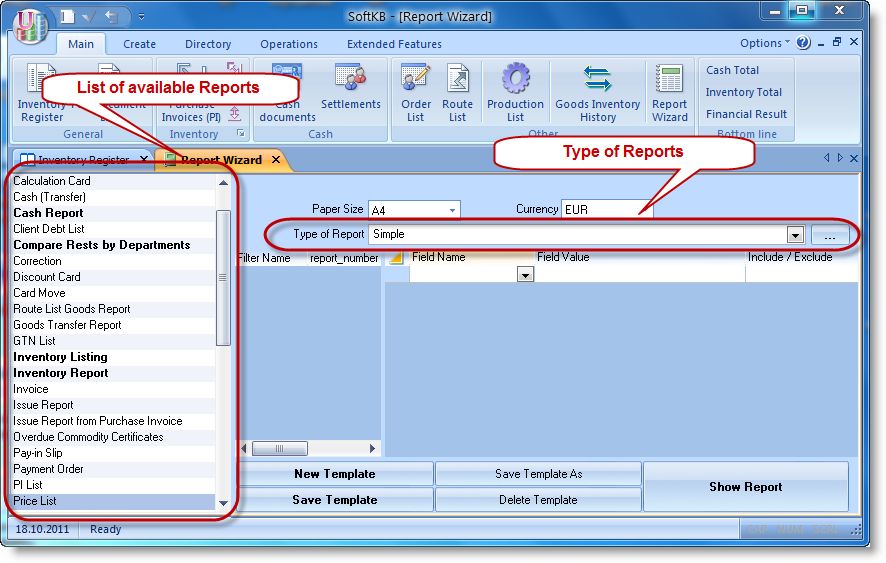
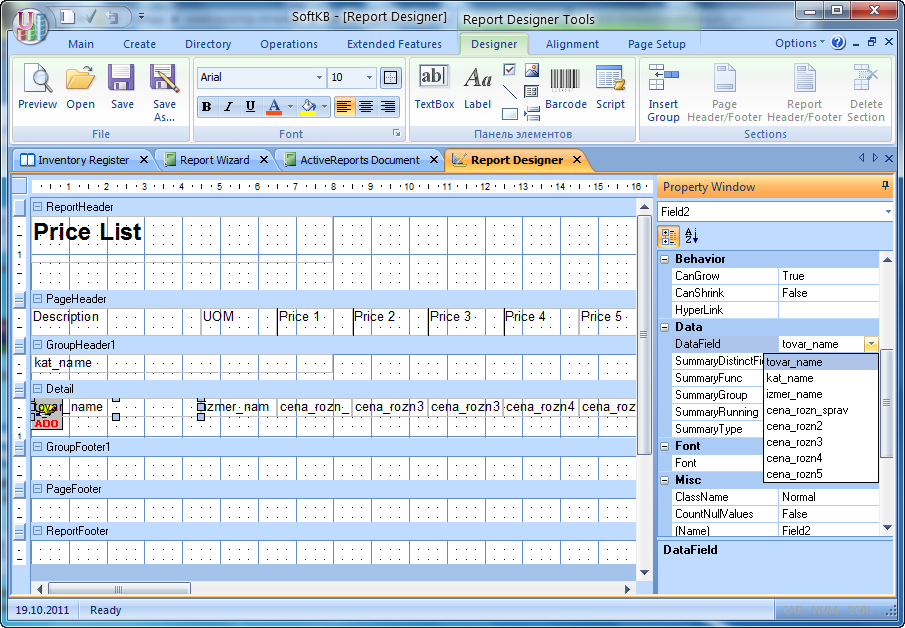
Window design with the layout empty report. To his right is located the properties window for the object TCU Report. In the Report Wizard (Report Wizard) drew attention to the properties and ReportWizardName ReportVariantName.
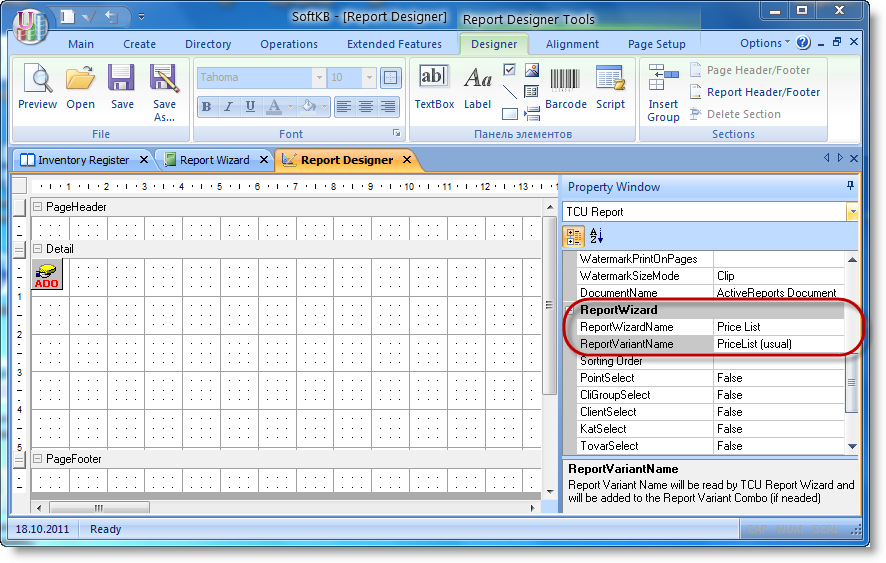
ReportWizardName (The name of the report in the wizard) - view the report from the list of available reports. In our case, this Price List, since this type of report was selected at the time of creation of a new report.
ReportVariantName store name version of the report for the current view of the report. In this line we write the name of our report Prices.
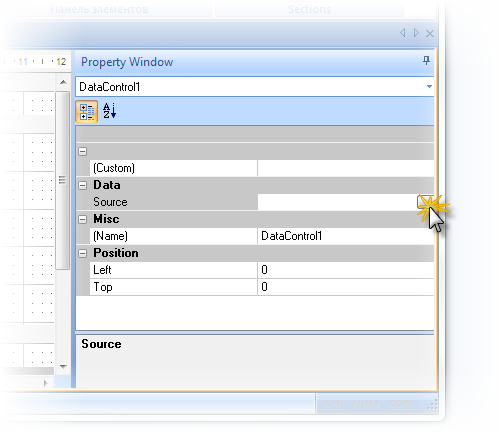
The layout of the new report, initially there is an element DataControl (Data Management), located in the data. It is through this element for communications report to the database. Isolate mouse element DataControl, to open the properties for that object. In line properties Source (Source) should put the text SQL query. Press the button "..." in the line properties Source.
window design SQL queries. Consider its structure.
1. Area tables query - a place where tables are placed and the connections between them.
2. Request Form - is designed to determine the fields and conditions, which will be used to retrieve the result set.
3. Tree available database tables.
4. Wood tables and fields from the current request.
5. Area resultant SQL code.
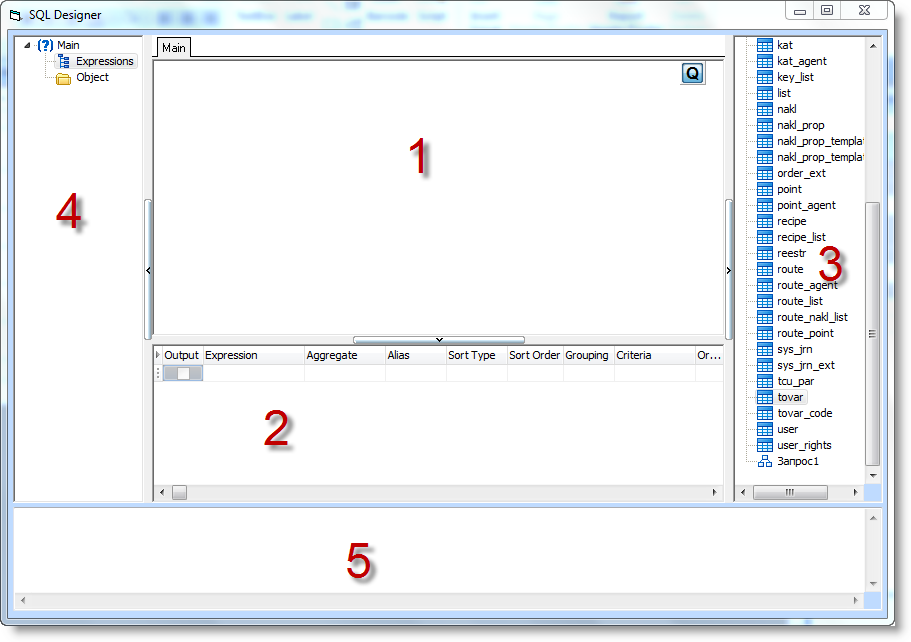
You can change the size of areas. To do this, place the cursor on the interface areas that he took a double-headed arrow and move the interface in the right direction.
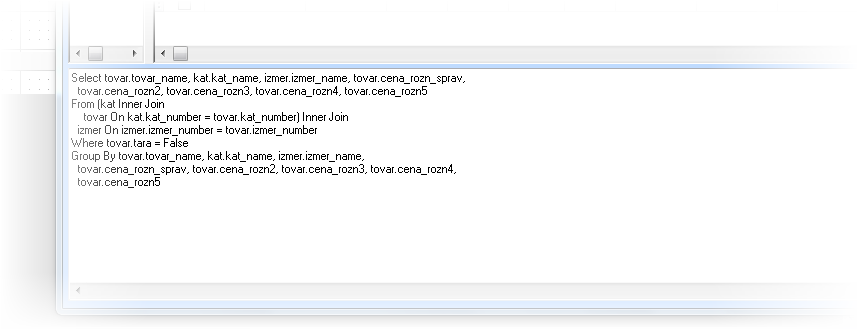
Enumerate what data we want to include in the report: groups of products, product names, unit of measurement, five reference price of the item cards.
We need the data contained in the following tables: kat, tovar, izmer.
Select the table on which to build a query. To this end, the tree of available database tables in the required tables, double click or just drag the mouse in the region table query. In the tables the query will layout selected tables.
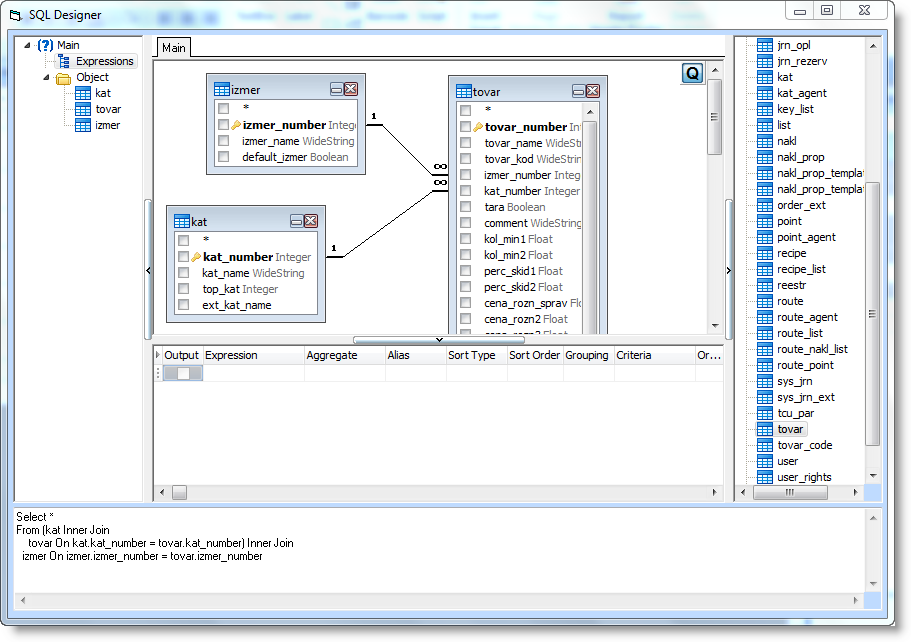
Tables can be moved to any place within the top of the query designer. It may be necessary if the scheme is very complicated, and need to improve its appearance.
Select the fields to build the query. We select the required field in the layout table and drag (or double-click) in the appropriate line request form.
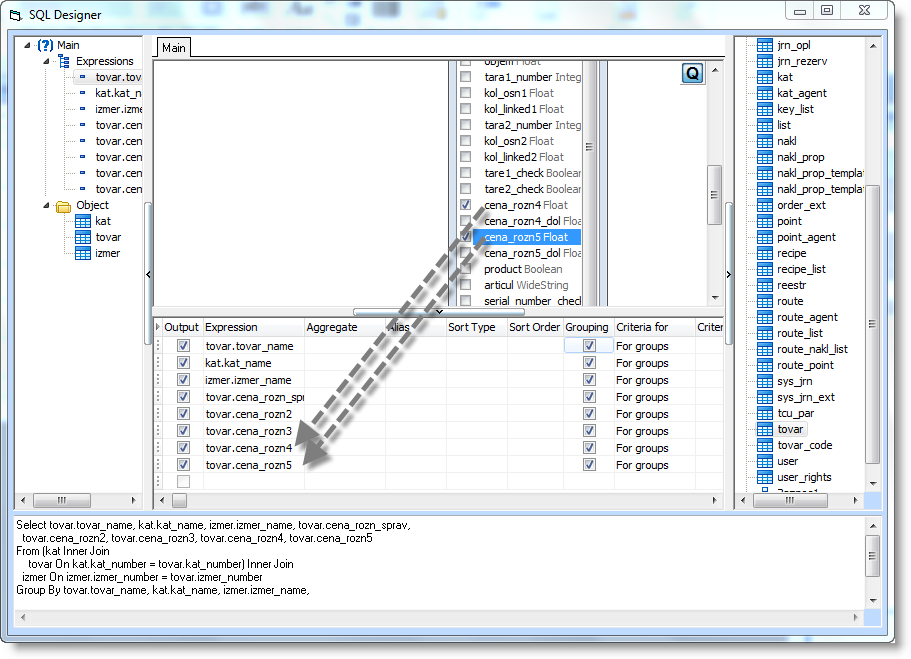
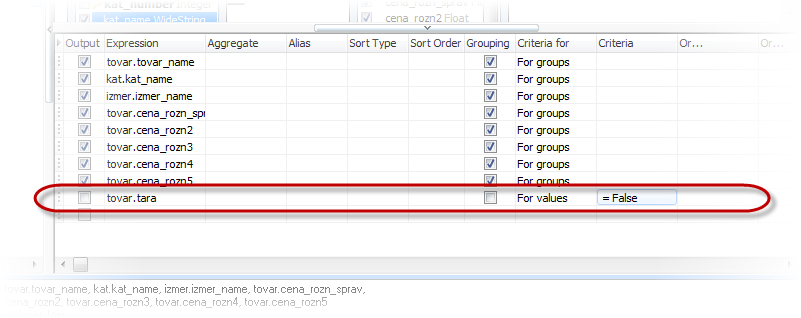
The Expression column contains the field names of the tables or expression (calculated fields). Output check box determines whether the present (show) this field in the result set data. This is useful when the field is used to specify the selection criteria, but there is no need to display the value of this field. For example, the price-list should not be included goods that are returnable packaging. In this case, we select the field [tara] in Table Tovar, clears display, and in the field criteria (Criteria) indicate the value=False.
As you add to the query tables and fields in the bottom of the window, in the resulting SQL code is automatically generated SQL-query.
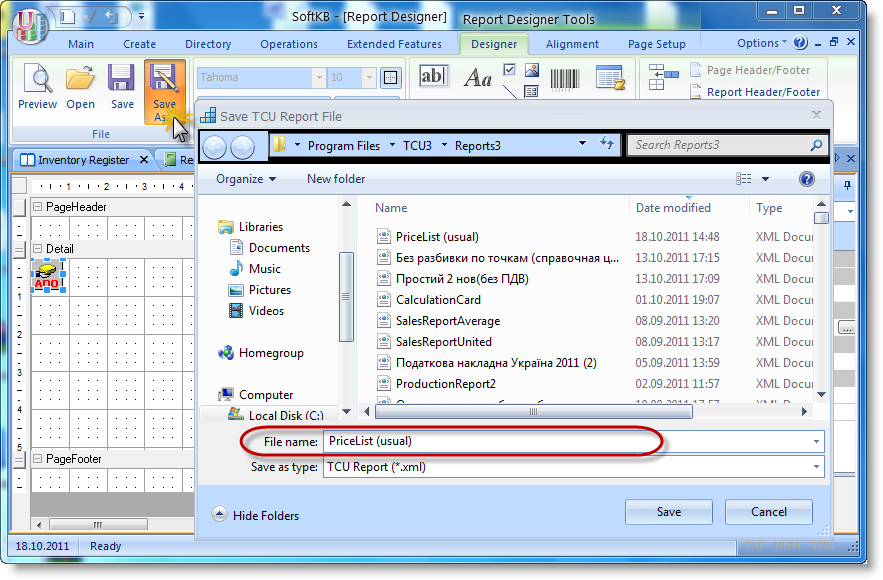
Zipping Designer SQL, save your changes. Pay attention, now the property Sourse contains the SQL-query. The Save as ... a dialog box «Save TCU Report file». Name the file "Price List" and save. TCU automatically puts the report in the Reports folder in the directory TCU3. After restarting the program saved report can be seen in the list of options for the report.
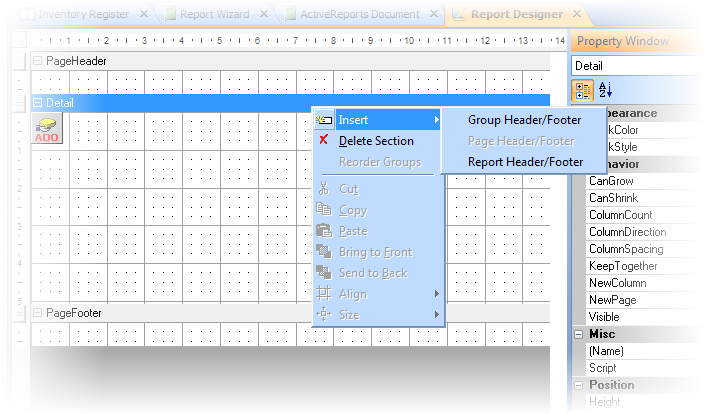
Now create a layout of the report. Reports can contain the following sections:
ReportHeader - the title of the report is printed only in the beginning of the report, is used on the front page.
PageHeader - page title (header), is printed at the top of each page, usually used as column headings for the output data.
GroupHeader - a group header is printed at the beginning of each group.
Ditail - the data area, where it is processed and printed in each record of the dynamic data set query.
GroupFooter - note the group is printed after processing the last recording group, is used to display the totals in the records of the current group.
PageFooter - note the page (footer) is printed at the bottom of each page, here usually include a page number.
ReportFooter - footer is printed at the end of the report after all data records and footers, displays the grand total for the entire report.
Necessary section in the new report can be added through the context menu, submenu, Insert
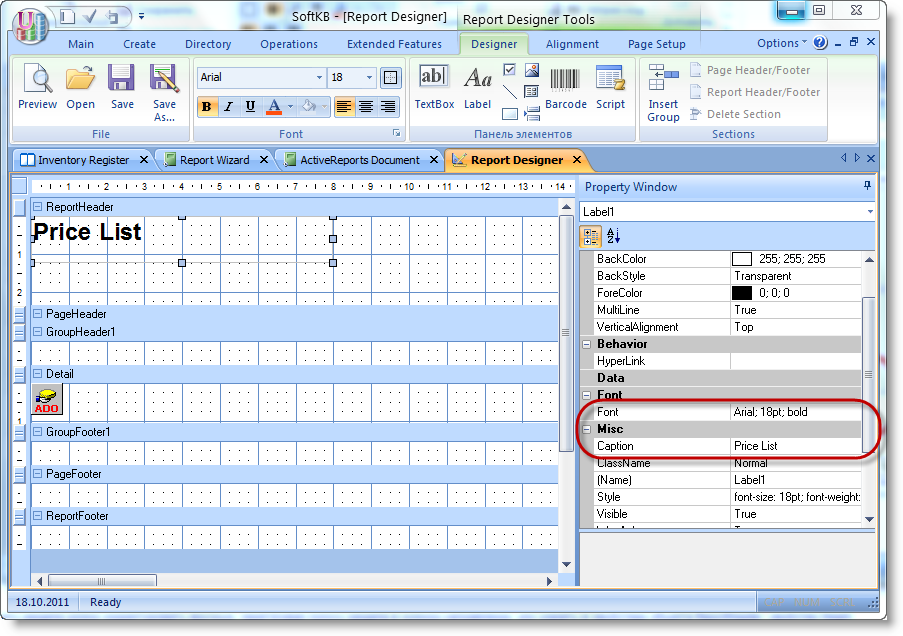
Main elements of the report are the label and textbox. With the element of "Label" in a report, you can display your text, such as title, caption, etc. With the element of "TextBox"(field) in the report displays information from the database. In the box you can use any type of data: text, numeric, logical, date/time, etc.
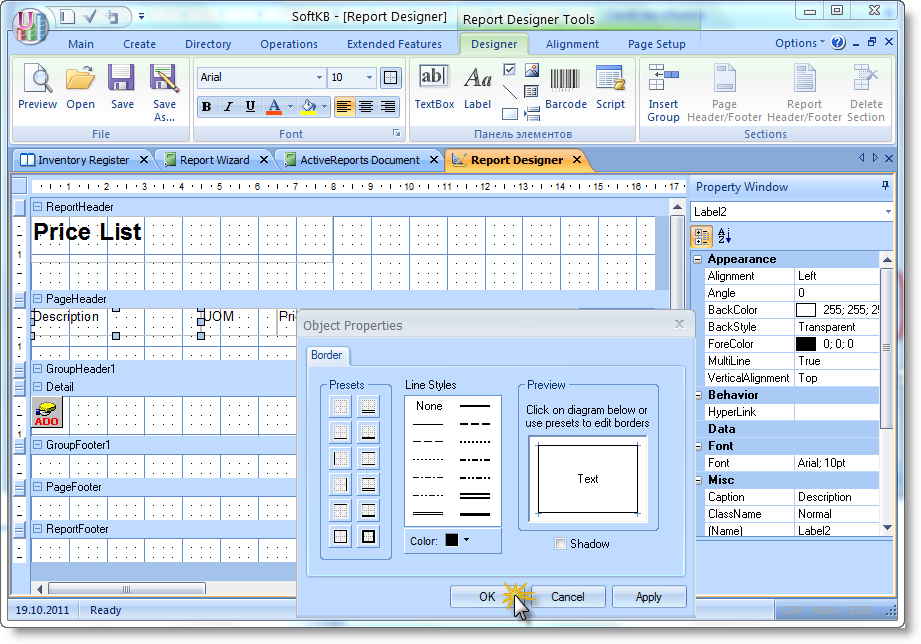
Click on "Label" on the Toolbox, place the cursor in the right place in the section ReportHeader and drag the mouse pointer (hold the left mouse button) that formed a rectangle. We have created an object label. To put the text into an element in the line properties Caption (text descriptions) type "Price List". The line properties Font (Font) Click on "...." In the dialog box "Font" we specify font properties in common Microsoft Office applications way. Font color and background color specified in the properties ForeColor and BackColor.
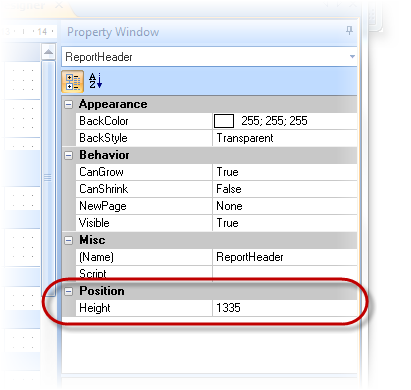
Height partition can be adjusted manually by dragging the bar section in the right direction, or point in the object properties ReportHeader, property Height.
Using the element of "Label", create the column headings of the report. For this purpose it is expedient to use the section PageHeader. In this case, the name of the column will be printed at the beginning of each page, which is convenient for multi-record.
Color, thickness, border style of element "Label" can be set through the context menu, Format Border or on the toolbar, as is usual in applications, MS Office.
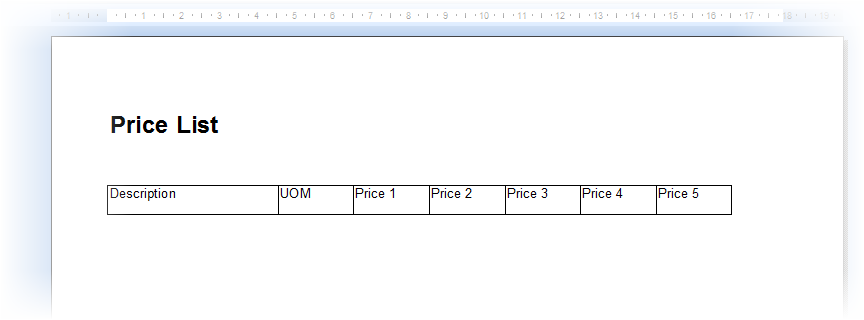
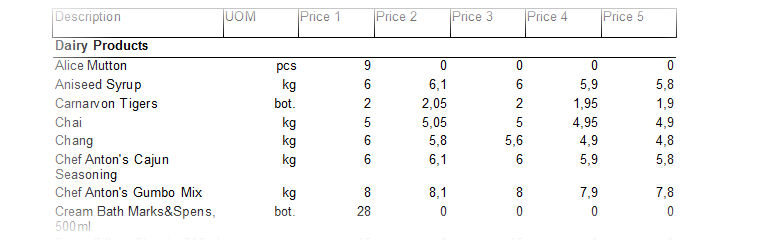
At any time you can open the report in view mode. To do this, switch to tab "Price List" by saving changes in Design view. Then double click on the name version of the report (right) will update the report. At this stage should look like this:
Create a field that will show us the necessary information from the database.
Group header should be placed in the section GroupHeader. Using the element of "Field" in the toolbox will create an object field. For properties DataField indicate the source of records. From the drop-down list select the field that sorted records (in this case kat_name).
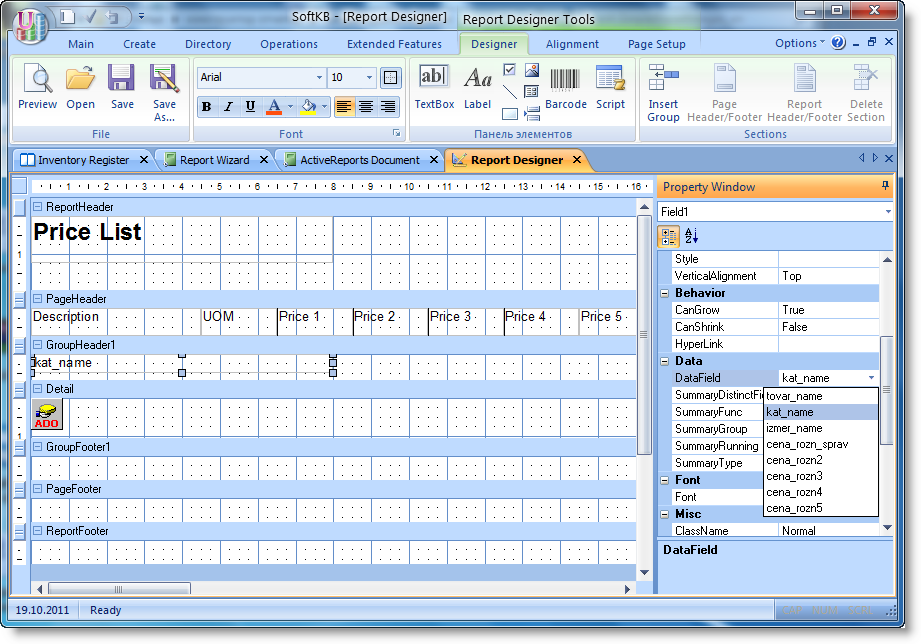
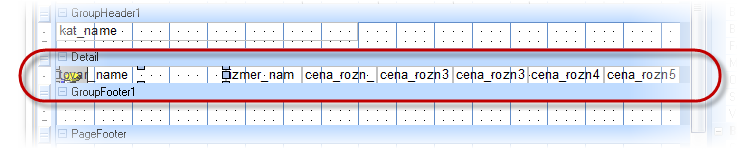
Now proceed to the creation of data for our report. Section Detail put seven properties field and set the size so that the fields were located directly under the names of columns. Next, set the format of the borders (similar to the object label) and specify the DataField properties of the sources of records for each object.
Should pay attention to the fact that in the field of data, controls over them, and no empty seats, which allows you to display records of data in the report as a whole.
New sections in the report are added in pairs. But our report does not use notes and the group page. To install only one section of a pair need to be manually or set the properties of the zero height of the section of the couples who do not need, and then set the value of NO for its property Visible.
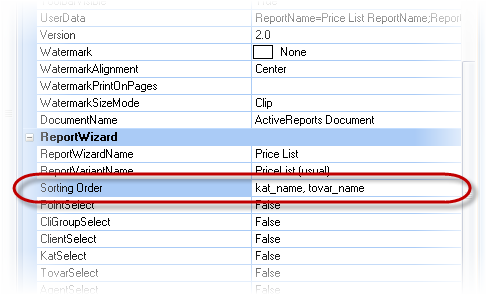
Sort records the final data set installed in a separate Properties object SortingOrder TCUReport. Our first sort the records by groups of goods, then the names of the goods.
Sorting is done on the field ext_kat_name to consider and sub-groups (sub-) products.
This form is ready to record in display mode.
Finally a few remarks.
When selecting tables and fields for a query can use the description of the database TCU, contact link.
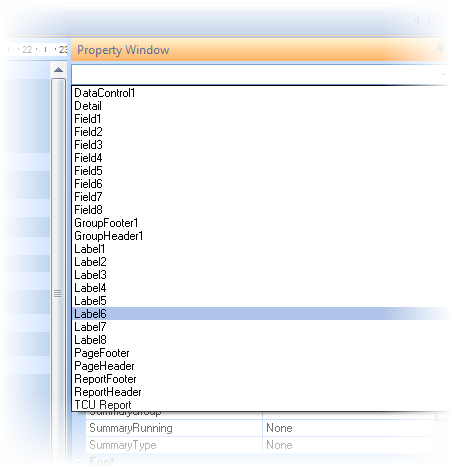
If you want to get back to work with the previously created element, you can choose it by clicking on it with the mouse or by selecting the desired item from the drop-down list in the Properties window object.
Your report (including custom reports TCU), you can change or modify, add to report request the necessary tables and fields. Previously on the button Save as ... reserve account under a different name so as not to overwrite the original record. In the Report Designer to create new controls - labels and fields.
Video lesson about the Report Designer