This article is a response to numerous questions on sharing SoftKuB and Tzu. Despite the fact that Tzu has powerful and convenient unit reporting, the records are static and decide clearly defined set of tasks. You should always have on hand the operational tools that not only prepare reports for printing, but will provide better picture of what happens in the company.
SoftKuB - a system for a thoughtful man who asks himself questions and seeking answers to them. How we work, where we're going, what our strengths and what weaknesses, what to put pressure where the impact, but from what can be waived - that's indicative list of the burning and sore during the initial phase of this tool.
What is the SoftKuB briefly? This OLAP, but I advise you not to bother with all sorts of acronyms and terms. Simply put, this is a table where we can move the columns and rows, rearrange them, apply filters to instantly calculate the results. All this is done by dragging and dropping the mouse over the column headings, rows and cells. Another said - "look at data from different angles," or "receive data in different slices." Describe what it means, more accessible language, a real example.
One of the most interesting questions for the CEO is the dynamics of sales. Let's see how to display our dynamic SoftKuB. To do this, load the file cube on this link extract it from the archive and double click to open it. Note that program SoftKuB you should be set. Also, you should be installed TCU. Open the cube of the form.

Isolate its final line simply release the mouse. Pay attention - to be automatically built sales chart in the section on a monthly basis.
Fact, TCU we could get this result, just released a report on sales for each month, write the data into Excel and plot the graph. But how long it would take? I think at least 15 minutes. Here we spend on this question-answer moment, no more. Pleased that our sales are growing, all we have, in general, good. And the head immediately raises another question: "Well, well, it's total sales, but what about the sales of individual product groups? All there be normal? "Answers. To do this, look for the right group at our table, which is called "the cube", and simply allocate the string with the mouse. Watch.
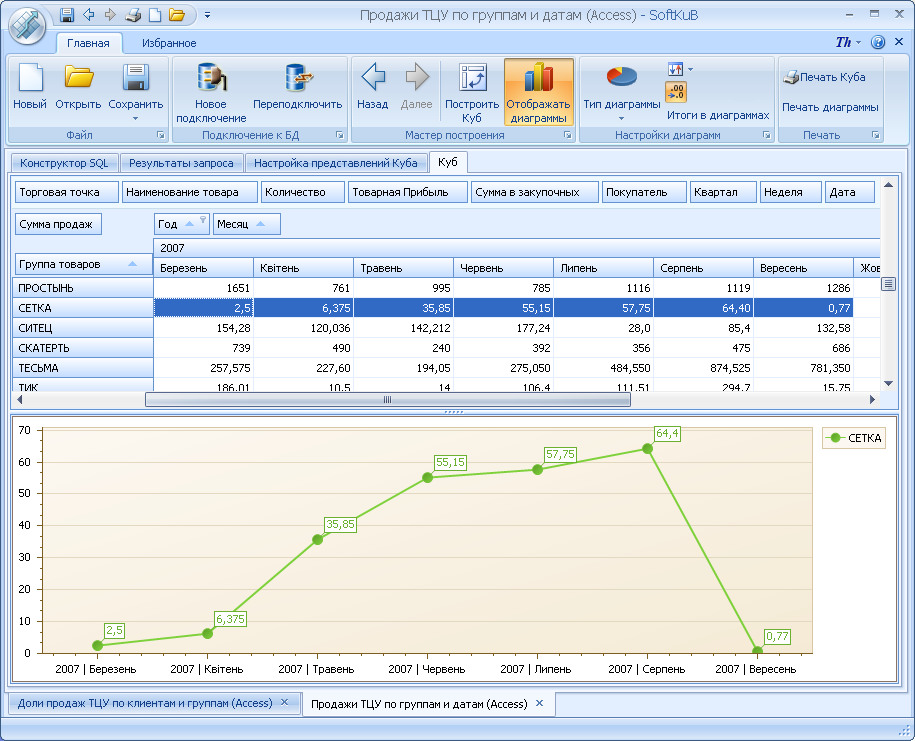
And here is becoming interesting (I specifically took this group of goods). Our net sells well in the summer and autumn selling it died along with mosquitoes. On the face of a pronounced seasonality. We'll see another group. Another seasonal item "Tile", so I think it tiles (a group of goods, rather than a specific product, we are now interested in the trend).
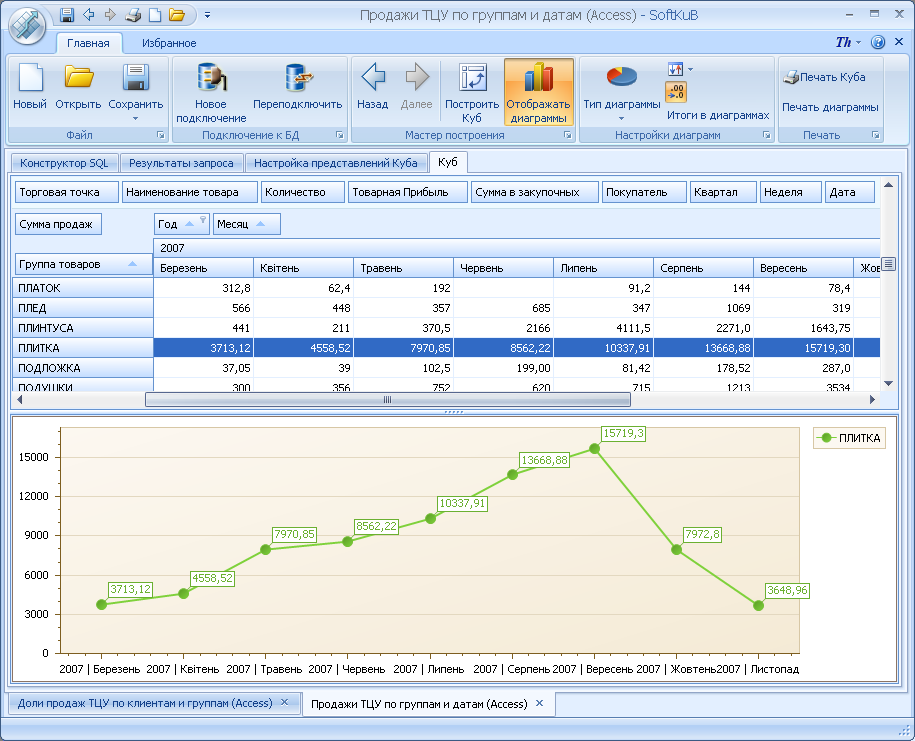
We have the same seasonality. But if our grid is sold in quantities miserable, then the tiles and more serious. Margin for the next season, or to make allowance and let tile for some action - the decision for guidance. For example, next year will be updated product range - then throw away bits, or vice versa, it is better to hold the tile until the next season. This is not my views, and yours.
Compare several groups of goods. To do this, allocate batches of mouse, hold down Ctrl, and look what happens.
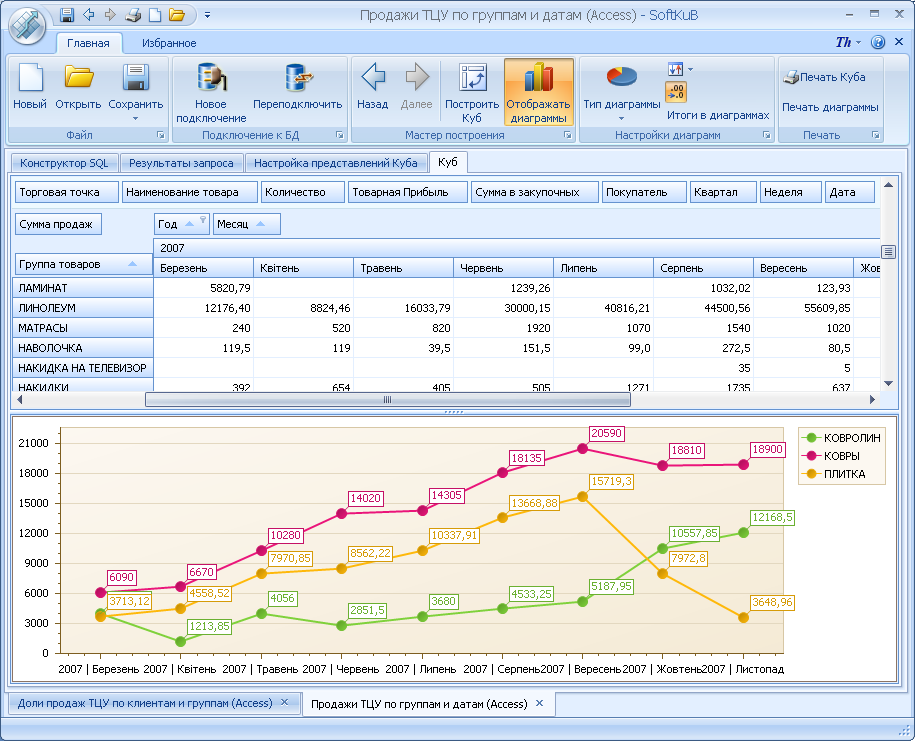
A rather interesting trend. On tile decline is understandable why, in late fall is busy with her little desire, with the carpets we just a steady demand, but the carpet in the course of the fall off. Do not ask me why - I do not know, just need to take a pencil wound on his mustache, and the nick on his nose. Homework. The cells of our cube had a total sales. Look at the profitability of sales last graph. To do this, drag the "commodity profits" from the area of filters in the data area, and return the "sum of sales" in the area of filters. Observe how to change our schedules. Thus, we looked at sales by product groups in the context of dates. Let's look at the same data from a different angle. Just drag from the area of filters in the region of lines of buyers, but from the field lines will return to the region of filter products. You can use ready-cube by downloading it
link.
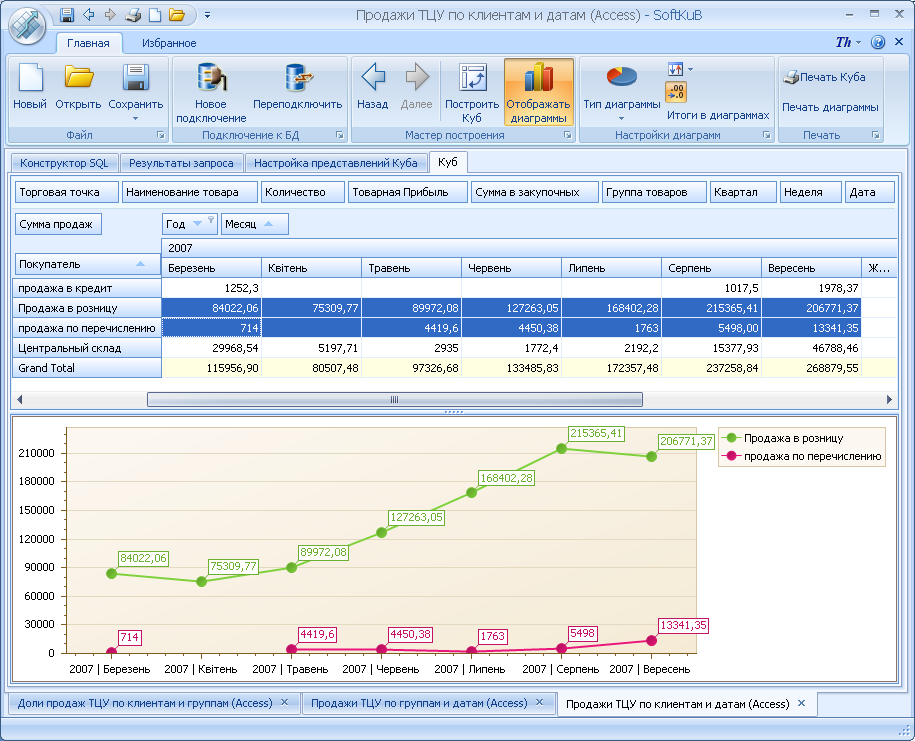
As we see, mostly the work is on retail sales, sale of transfer just relax, and credits, I did not even produce.
Consider the other not less interesting section. In rows we will have customers, the columns of products. Download this cube can be
link.
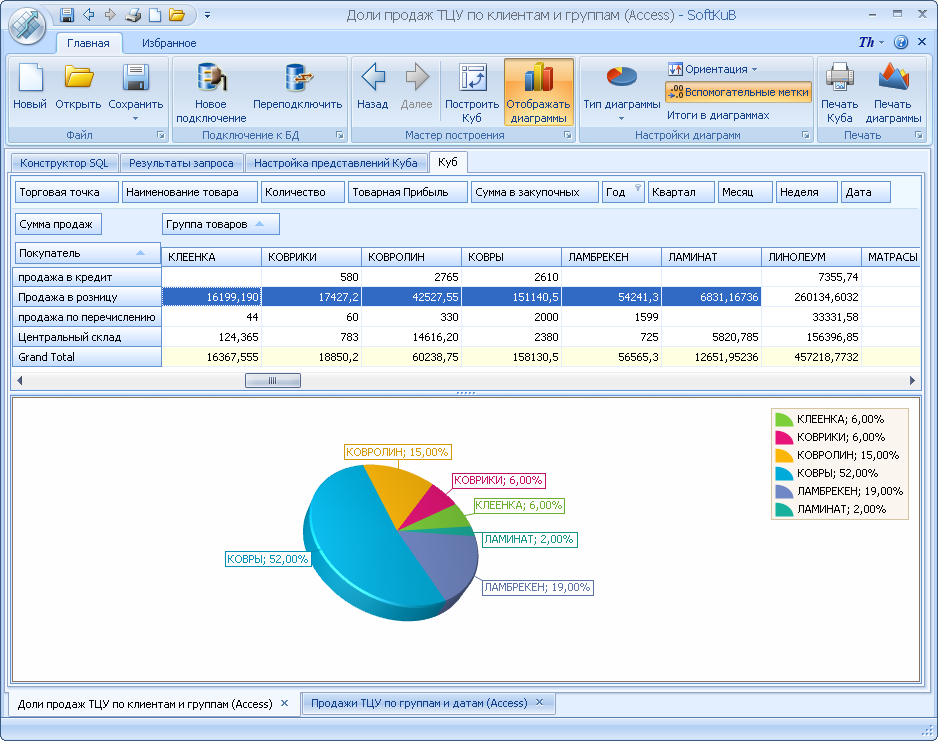
Note that the ratio of sales to selected groups represented in the diagram. In general, try. I would be happy reviews.